Tuesday, January 29, 2013

Canada Economy Profile 2012


Economy


As an affluent, high-tech industrial society in the trillion-dollar class, Canada resembles the US in its market-oriented economic system, pattern of production, and affluent living standards. Since World War II, the impressive growth of the manufacturing, mining, and service sectors has transformed the nation from a largely rural economy into one primarily industrial and urban. The 1989 US-Canada Free Trade Agreement (FTA) and the 1994 North American Free Trade Agreement (NAFTA) (which includes Mexico) touched off a dramatic increase in trade and economic integration with the US its principal trading partner. Canada enjoys a substantial trade surplus with the US, which absorbs about three-fourths of Canadian exports each year. Canada is the US's largest foreign supplier of energy, including oil, gas, uranium, and electric power. Given its great natural resources, highly skilled labor force, and modern capital plant, Canada enjoyed solid economic growth from 1993 through 2007. Buffeted by the global economiccrisis, the economy dropped into a sharp recession in the final months of 2008, and Ottawa posted its first fiscal deficit in 2009 after 12 years of surplus. Canada''s major banks, however, emerged from the financial crisis of 2008-09 among the strongest in the world, owing to the financial sector''s tradition of conservative lending practices and strong capitalization. Canada achieved marginal growth in 2010 and 2011 and plans to balance the budget by 2015. In addition, the country''s petroleum sector is rapidly becoming an even larger economic driver with Alberta''s oil sands significantly boosting Canada''s proven oil reserves, ranking the country third in the world behind Saudi Arabia and Venezuela.

GDP (purchasing power parity)


$1.389 trillion (2011 est.)
$1.359 trillion (2010 est.)
$1.318 trillion (2009 est.)
note: data are in 2011 US dollars

GDP (official exchange rate)


$1.759 trillion (2011 est.)

GDP - real growth rate


2.2% (2011 est.)
3.1% (2010 est.)
-2.5% (2009 est.)

GDP - per capita (PPP)


$40,300 (2011 est.)
$39,100 (2010 est.)
$37,900 (2009 est.)
note: data are in 2011 US dollars

GDP - composition by sector


agriculture: 1.9%
industry: 27.1%
services: 71% (2011 est.)

Population below poverty line


9.4%
note: this figure is the Low Income Cut-Off (LICO), a calculation that results in higher figures than found in many comparable economies; Canada does not have an official poverty line (2008)

Labor force


18.67 million (2011 est.)

Labor force - by occupation


agriculture: 2%
manufacturing: 13%
construction: 6%
services: 76%
other: 3% (2006 est.)

Unemployment rate


7.5% (2011 est.)
8% (2010 est.)

Unemployment, youth ages 15-24


total: 15.3%
male: 18.1%
female: 12.4% (2009)

Household income or consumption by percentage share


lowest 10%: 2.6%
highest 10%: 24.8% (2000)

Distribution of family income - Gini index


32.1 (2005)
31.5 (1994)

Investment (gross fixed)


22.6% of GDP (2011 est.)

Budget


revenues: $660.2 billion
expenditures: $747.8 billion (2011 est.)

Taxes and other revenues


38.5% of GDP (2011 est.)

Budget surplus (+) or deficit (-)


-3.8% of GDP (2011 est.)
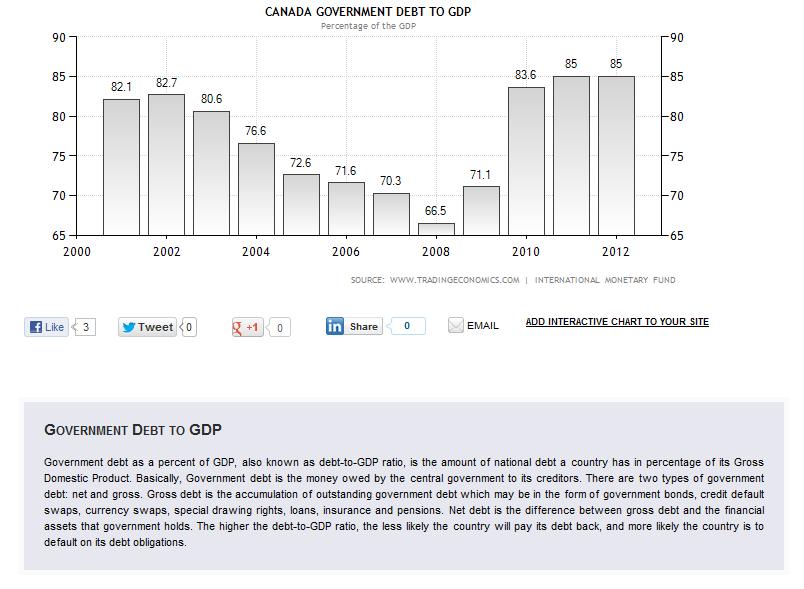
Public debt


83.5% of GDP (2011 est.)
84% of GDP (2010 est.)
note: figures are for gross general government debt, as opposed to net federal debt; gross general government debt includes both intragovernmental debt and the debt of public entities at the sub-national level

Inflation rate (consumer prices)


2.8% (2011 est.)
1.8% (2010 est.)

Central bank discount rate


1% (31 December 2010 est.)
0.25% (31 December 2009 est.)

Commercial bank prime lending rate


3% (31 December 2011 est.)
2.604% (31 December 2010 est.)

Stock of narrow money


$626 billion (31 December 2011 est.)
$585.5 billion (31 December 2010 est.)

Stock of money


$356.2 billion (31 December 2008)
$391.6 billion (31 December 2007)

Stock of quasi money


$1.299 trillion (31 December 2008)
$1.381 trillion (31 December 2007)

Stock of broad money


$1.433 trillion (31 December 2011 est.)
$1.356 trillion (31 December 2010 est.)

Stock of domestic credit


$2.731 trillion (31 December 2010 est.)
$2.488 trillion (31 December 2009 est.)

Market value of publicly traded shares


$2.16 trillion (31 December 2010)
$1.681 trillion (31 December 2009)
$1.002 trillion (31 December 2008)

Agriculture - products


wheat, barley, oilseed, tobacco, fruits, vegetables; dairy products; fish; forest products
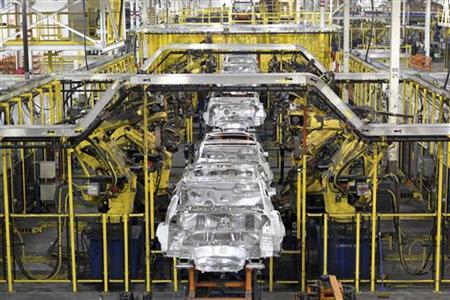
Industries


transportation equipment, chemicals, processed and unprocessed minerals, food products, wood and paper products, fish products, petroleum and natural gas

Industrial production growth rate


3.7% (2011 est.)

Electricity - production


604.4 billion kWh (2009 est.)

Electricity - production by source


fossil fuel: 28%
hydro: 57.9%
nuclear: 12.9%
other: 1.3% (2001)

Electricity - consumption


549.5 billion kWh (2008 est.)

Electricity - exports


51.11 billion kWh (2009 est.)

Electricity - imports


33.62 billion kWh (2009 est.)

Oil - production


3.483 million bbl/day (2010 est.)

Oil - consumption


2.209 million bbl/day (2010 est.)

Oil - exports


1.929 million bbl/day (2009 est.)

Oil - imports


1.088 million bbl/day (2009 est.)

Oil - proved reserves


175.2 billion bbl
note: includes oil sands (1 January 2011 est.)

Natural gas - production


152.3 billion cu m (2010 est.)

Natural gas - consumption


82.48 billion cu m (2010 est.)

Natural gas - exports


92.4 billion cu m (2010 est.)

Natural gas - imports


22.53 billion cu m (2010 est.)

Natural gas - proved reserves


1.754 trillion cu m (1 January 2011 est.)

Current Account Balance


-$52.6 billion (2011 est.)
-$49.37 billion (2010 est.)

Exports


$450.6 billion (2011 est.)
$393 billion (2010 est.)

Exports - commodities


motor vehicles and parts, industrial machinery, aircraft, telecommunications equipment; chemicals, plastics, fertilizers; wood pulp, timber, crude petroleum, natural gas, electricity, aluminum

Exports - partners


US 74.9%, UK 4.1% (2009)

Imports


$459.6 billion (2011 est.)
$401.7 billion (2010 est.)

Imports - commodities


machinery and equipment, motor vehicles and parts, crude oil, chemicals, electricity, durable consumer goods

Imports - partners


US 50.4%, China 11%, Mexico 5.5% (2009)

Reserves of foreign exchange and gold


$57.15 billion (31 December 2010 est.)

Debt - external


$1.181 trillion (30 June 2011)
$1.009 trillion (30 June 2010)

Stock of direct foreign investment - at home


$596.8 billion (31 December 2011 est.)
$561.1 billion (31 December 2010 est.)

Stock of direct foreign investment - abroad


$659.8 billion (31 December 2011 est.)
$616.1 billion (31 December 2010 est.)

Friday, January 25, 2013

Albania Economy Profile 2012


Albania, a formerly closed, centrally-planned state, is making the difficult transition to a more modern open-market economy. Macroeconomic growth averaged around 6% between 2004-08, but declined to about 3% in 2009-11. Inflation is low and stable. The government has taken measures to curb violent crime, and recently adopted a fiscal reform package aimed at reducing the large gray economy and attracting foreign investment. Remittances, a significant catalyst for economic growth declined from 12-15% of GDP before the 2008 financial crisis to 8% of GDP in 2010, mostly from Albanians residing in Greece and Italy. The agricultural sector, which accounts for almost half of employment but only about one-fifth of GDP, is limited primarily to small family operations and subsistence farming because of lack of modern equipment, unclear property rights, and the prevalence of small, inefficient plots of land. Energy shortages because of a reliance on hydropower - 98% of the electrical power produced in Albania - and antiquated and inadequate infrastructure contribute to Albania's poor business environment and lack of success in attracting new foreign investment needed to expand the country's export base. FDI is among the lowest in the region, but the government has embarked on an ambitious program to improve the business climate through fiscal and legislative reforms. The completion of a new thermal power plant near Vlore has helped diversify generation capacity, and plans to upgrade transmission lines between Albania and Montenegro and Kosovo would help relieve the energy shortages. Also, with help from EU funds, the government is taking steps to improve the poor national road and rail network, a long-standing barrier to sustained economic growth. The country will continue to face challenges from increasing public debt, approaching its statutory limit of 60% of GDP. Strong trade, remittance, and banking sector ties with Greece and Italy make Albania vulnerable to spillover effects of the global financial crisis.

GDP (purchasing power parity)


$24.99 billion (2011 est.)
$24.38 billion (2010 est.)
$23.56 billion (2009 est.)
note: data are in 2011 US dollars
Albania has an informal, and unreported, sector that may be as large as 50% of official GDP

GDP (official exchange rate)


$13.3 billion (2011 est.)

GDP - real growth rate


2.5% (2011 est.)
3.5% (2010 est.)
3.3% (2009 est.)

GDP - per capita (PPP)


$7,800 (2011 est.)
$7,600 (2010 est.)
$7,400 (2009 est.)
note: data are in 2011 US dollars

GDP - composition by sector


agriculture: 20.7%
industry: 19.7%
services: 59.6% (2011 est.)

Population below poverty line


12.5% (2008 est.)

Labor force


1.053 million (2010 est.)

Labor force - by occupation


agriculture: 47.8%
industry: 23%
services: 29.2% (September 2010 est.)

Unemployment rate


13.3% (2011 est.)
13.7% (2010 est.)
note: these are official rates, but actual rates may exceed 30% due to preponderance of near-subsistence farming

Unemployment, youth ages 15-24


total: 35.5%
male: 41.6%
female: 27.1% (2001)

Household income or consumption by percentage share


lowest 10%: 3.5%
highest 10%: 29% (2008)

Distribution of family income - Gini index


34.5 (2008)
26.7 (2005)

Investment (gross fixed)


29.9% of GDP (2011 est.)

Budget


revenues: $3.405 billion
expenditures: $3.87 billion (2011 est.)

Taxes and other revenues


25.6% of GDP (2011 est.)

Budget surplus (+) or deficit (-)


-3.5% of GDP (2011 est.)

Public debt


59.4% of GDP (2011 est.)
57.1% of GDP (2010 est.)

Inflation rate (consumer prices)


3.9% (2011 est.)
3.5% (2010 est.)

Central bank discount rate


5% (31 December 2010 est.)
5.25% (31 December 2009 est.)

Commercial bank prime lending rate


13.2% (31 December 2011 est.)
12.833% (31 December 2010 est.)

Stock of money


$3.028 billion (31 December 2008)
$2.707 billion (31 December 2007)

Stock of narrow money


$2.741 billion (31 December 2011 est.)
$2.648 billion (31 December 2010 est.)

Stock of quasi money


$6.251 billion (31 December 2008)
$6.433 billion (31 December 2007)

Stock of broad money


$6.37 billion (31 December 2011 est.)
$9.426 billion (31 December 2010 est.)

Stock of domestic credit


$8.506 billion (31 December 2011 est.)
$7.948 billion (31 December 2010 est.)

Market value of publicly traded shares


$NA

Agriculture - products


wheat, corn, potatoes, vegetables, fruits, sugar beets, grapes; meat, dairy products

Industries


food processing, textiles and clothing; lumber, oil, cement, chemicals, mining, basic metals, hydropower

Industrial production growth rate


3% (2010 est.)

Electricity - production


5.201 billion kWh (2009 est.)

Electricity - production by source


fossil fuel: 2.9%
hydro: 97.1%
nuclear: 0%
other: 0% (2001)

Electricity - consumption


6.593 billion kWh
note: 35% of electricity is lost in the system as a result of transmission inefficiencies and theft (2009 est.)

Electricity - exports


0 kWh (2009 est.)

Electricity - imports


1.884 billion kWh (2009 est.)

Oil - production


10,930 bbl/day (2010 est.)

Oil - consumption


33,000 bbl/day (2010 est.)

Oil - exports


1,004 bbl/day (2009 est.)

Oil - imports


22,880 bbl/day (2009 est.)

Oil - proved reserves


199.1 million bbl (1 January 2011 est.)

Natural gas - production


30 million cu m (2009 est.)

Natural gas - consumption


30 million cu m (2009 est.)

Natural gas - exports


0 cu m (2010 est.)

Natural gas - imports


0 cu m (2010 est.)

Natural gas - proved reserves


849.5 million cu m (1 January 2011 est.)

Current Account Balance


-$1.38 billion (2011 est.)
-$1.404 billion (2010 est.)

Exports


$1.886 billion (2011 est.)
$1.548 billion (2010 est.)

Exports - commodities


textiles and footwear; asphalt, metals and metallic ores, crude oil; vegetables, fruits, tobacco

Exports - partners


Italy 50.8%, Kosovo 6.2%, Turkey 5.9%, Greece 5.4%, China 5.5% (2010 est.)

Imports


$5.022 billion (2011 est.)
$4.305 billion (2010 est.)

Imports - commodities


machinery and equipment, foodstuffs, textiles, chemicals

Imports - partners


Italy 28%, Greece 13%, China 6.3%, Turkey 5.6%, Germany 5.6% (2010 est.)

Reserves of foreign exchange and gold


$2.725 billion (31 December 2011 est.)
$2.541 billion (31 December 2010 est.)

Debt - external


$5.7 billion (31 December 2011 est.)
$5 billion (31 December 2010 est.)

Italy Economy Profile 2012


Italy has a diversified industrial economy, which is divided into a developed industrial north, dominated by private companies, and a less-developed, welfare-dependent, agricultural south, with high unemployment. The Italian economy is driven in large part by the manufacture of high-quality consumer goods produced by small and medium-sized enterprises, many of them family owned. Italy also has a sizable underground economy, which by some estimates accounts for as much as 17% of GDP. These activities are most common within the agriculture, construction, and service sectors. Italy is the third-largest economy in the euro-zone, but exceptionally high public debt burdens and structural impediments to growth have rendered it vulnerable to scrutiny by financial markets. Public debt has increased steadily since 2007, reaching 120% of GDP in 2011, and borrowing costs on sovereign government debt have risen to record levels. During the second half of 2011 the government passed a series of three austerity packages to balance its budget by 2013 and decrease its public debt burden. These measures included a hike in the value-added tax, pension reforms, and cuts to public administration. The government also faces pressure from investors and European partners to address Italy's long-standing structural impediments to growth, such as an inflexible labor market and widespread tax evasion. The international financial crisis worsened conditions in Italy''s labor market, with unemployment rising from 6.2% in 2007 to 8.4% in 2011, but in the longer-term Italy''s low fertility rate and quota-driven immigration policies will increasingly strain its economy. The euro-zone crisis along with Italian austerity measures have reduced exports and domestic demand, slowing Italy''s recovery. Italy''s GDP is still 5% below its 2007 pre-crisis level.

GDP (purchasing power parity)


$1.822 trillion (2011 est.)
$1.814 trillion (2010 est.)
$1.791 trillion (2009 est.)
note: data are in 2011 US dollars

GDP (official exchange rate)


$2.246 trillion (2011 est.)

GDP - real growth rate


0.4% (2011 est.)
1.3% (2010 est.)
-5.2% (2009 est.)

GDP - per capita (PPP)


$30,100 (2011 est.)
$30,100 (2010 est.)
$29,800 (2009 est.)
note: data are in 2011 US dollars

GDP - composition by sector


agriculture: 2%
industry: 24.7%
services: 73.4% (2011 est.)

Population below poverty line


NA%

Labor force


25.08 million (2011 est.)

Labor force - by occupation


agriculture: 3.9%
industry: 28.3%
services: 67.8% (2011)

Unemployment rate


8.4% (2011 est.)
8.4% (2010 est.)

Unemployment, youth ages 15-24


total: 25.4%
male: 23.3%
female: 28.7% (2009)

Household income or consumption by percentage share


lowest 10%: 2.3%
highest 10%: 26.8% (2000)

Distribution of family income - Gini index


32 (2006)
27.3 (1995)

Investment (gross fixed)


20.5% of GDP (2011 est.)

Budget


revenues: $1.025 trillion
expenditures: $1.112 trillion (2011 est.)

Taxes and other revenues


46.4% of GDP (2011 est.)

Budget surplus (+) or deficit (-)


-3.6% of GDP (2011 est.)

Public debt


120.1% of GDP (2011 est.)
119.1% of GDP (2010 est.)
note: Italy reports its data on public debt according to guidelines set out in the Maastricht Treaty; general government gross debt is defined in the Maastricht Treaty as consolidated general government gross debt at nominal value, outstanding at the end of the year, in the following categories of government liabilities (as defined in ESA95): currency and deposits (AF.2), securities other than shares excluding financial derivatives (AF.3, excluding AF.34), and loans (AF.4); the general government sector comprises the central government, state government, local government and social security funds

Inflation rate (consumer prices)


2.8% (2011 est.)
1.7% (2010)

Central bank discount rate


1.75% (31 December 2011)
1.75% (31 December 2010)
note: this is the European Central Bank's rate on the marginal lending facility, which offers overnight credit to banks in the euro area

Commercial bank prime lending rate


4.5% (31 December 2011 est.)
4.032% (31 December 2010 est.)

Stock of narrow money


$1.265 trillion (31 December 2011 est.)
$1.205 trillion (31 December 2010 est.)
note: see entry for the European Union for money supply in the euro area; the European Central Bank (ECB) controls monetary policy for the 17 members of the Economic and Monetary Union (EMU); individual members of the EMU do not control the quantity of money circulating within their own borders

Stock of broad money


$2.269 trillion (31 December 2011 est.)
$2.065 trillion (31 December 2010 est.)

Stock of domestic credit


$3.469 trillion (31 December 2011 est.)
$3.221 trillion (31 December 2010 est.)

Market value of publicly traded shares


$318.1 billion (31 December 2010)
$317.3 billion (31 December 2009)
$520.9 billion (31 December 2008)

Agriculture - products


fruits, vegetables, grapes, potatoes, sugar beets, soybeans, grain, olives; beef, dairy products; fish

Industries


tourism, machinery, iron and steel, chemicals, food processing, textiles, motor vehicles, clothing, footwear, ceramics

Industrial production growth rate


0.2% (2011 est.)

Electricity - production


290.7 billion kWh (2010 est.)

Electricity - production by source


fossil fuel: 78.6%
hydro: 18.4%
nuclear: 0%
other: 3% (2001)

Electricity - consumption


309.9 billion kWh (2010 est.)

Electricity - exports


1.826 billion kWh (2010 est.)

Electricity - imports


4.599 billion kWh (2010 est.)

Oil - production


151,800 bbl/day (2010 est.)

Oil - consumption


1.528 million bbl/day (2010 est.)

Oil - exports


529,100 bbl/day (2009 est.)

Oil - imports


1.8 million bbl/day (2009 est.)

Oil - proved reserves


476.5 million bbl (1 January 2011 est.)

Natural gas - production


8.4 billion cu m (2011 est.)

Natural gas - consumption


77.8 billion cu m (2011 est.)

Natural gas - exports


139 million cu m (2010 est.)

Natural gas - imports


70.2 billion cu m (2011 est.)

Natural gas - proved reserves


63.57 billion cu m (1 January 2011 est.)

Current Account Balance


-$77.8 billion (2011 est.)
-$67.94 billion (2010 est.)

Exports


$522 billion (2011 est.)
$448.4 billion (2010 est.)

Exports - commodities


engineering products, textiles and clothing, production machinery, motor vehicles, transport equipment, chemicals; food, beverages and tobacco; minerals, and nonferrous metals

Exports - partners


Germany 13%, France 11.6%, US 6%, Spain 5.9%, UK 5.2%, Switzerland 4.7% (2009)

Imports


$556.4 billion (2011 est.)
$473.1 billion (2010 est.)

Imports - commodities


engineering products, chemicals, transport equipment, energy products, minerals and nonferrous metals, textiles and clothing; food, beverages, and tobacco

Imports - partners


Germany 16.1%, France 8.8%, China 7.8%, Netherlands 5.4%, Spain 4.6% (2009)

Reserves of foreign exchange and gold


$158.9 billion (31 December 2010 est.)
$132.8 billion (31 December 2009 est.)

Debt - external


$2.684 trillion (30 June 2011 est.)
$2.223 trillion (30 June 2010 est.)

Stock of direct foreign investment - at home


$412.1 billion (31 December 2011 est.)
$403 billion (31 December 2010 est.)

Stock of direct foreign investment - abroad


$630.5 billion (31 December 2011 est.)
$601.4 billion (31 December 2010 est.)

Germany Economy Profile 2012


The German economy - the fifth largest economy in the world in PPP terms and Europe's largest - is a leading exporter of machinery, vehicles, chemicals, and household equipment and benefits from a highly skilled labor force. Like its Western European neighbors, Germany faces significant demographic challenges to sustained long-term growth. Low fertility rates and declining net immigration are increasing pressure on the country's social welfare system and necessitate structural reforms. Reforms launched by the government of Chancellor Gerhard SCHROEDER (1998-2005), deemed necessary to address chronically high unemployment and low average growth, contributed to strong growth in 2006 and 2007 and falling unemployment. These advances, as well as a government subsidized, reduced working hour scheme, help explain the relatively modest increase in unemployment during the 2008-09 recession - the deepest since World War II - and its decrease to 6.0% in 2011. GDP contracted 5.1% in 2009 but grew by 3.6% in 2010, and 2.7% in 2011. The recovery was attributable primarily to rebounding manufacturing orders and exports - increasingly outside the Euro Zone. Germany's central bank projects that GDP will grow 0.6% in 2012, a reflection of the worsening euro-zone financial crisis and the financial burden it places on Germany as well as falling demand for German exports. Domestic demand is therefore becoming a more significant driver of Germany's economic expansion. Stimulus and stabilization efforts initiated in 2008 and 2009 and tax cuts introduced in Chancellor Angela MERKEL's second term increased Germany's budget deficit to 3.3% in 2010, but slower spending and higher tax revenues reduce the deficit to 1.7% in 2011, below the EU's 3% limit. A constitutional amendment approved in 2009 limits the federal government to structural deficits of no more than 0.35% of GDP per annum as of 2016. Following the March 2011 Fukushima nuclear disaster, Chancellor Angela Merkel announced in May 2011 that eight of the country's 17 nuclear reactors would be shut down immediately and the remaining plants would close by 2022. Germany hopes to replace nuclear power with renewable energy. Before the shutdown of the eight reactors, Germany relied on nuclear power for 23% of its energy and 46% of its base-load electrical production.
The German economy goes into surplus for the first time since 2007, German gdp economy

GDP (purchasing power parity)


$3.085 trillion (2011 est.)
$3.003 trillion (2010 est.)
$2.9 trillion (2009 est.)
note: data are in 2011 US dollars

GDP (official exchange rate)


$3.629 trillion (2011 est.)

GDP - real growth rate


2.7% (2011 est.)
3.6% (2010 est.)
-5.1% (2009 est.)

GDP - per capita (PPP)


$37,900 (2011 est.)
$36,800 (2010 est.)
$35,500 (2009 est.)
note: data are in 2011 US dollars

GDP - composition by sector


agriculture: 0.8%
industry: 28.6%
services: 70.6% (2011 est.)

Population below poverty line


15.5% (2010 est.)

Labor force


43.62 million (2011 est.)

Labor force - by occupation


agriculture: 1.6%
industry: 24.6%
services: 73.8% (2011)

Unemployment rate


6% (2011 est.)
6.8% (2010 est.)
note: this is the International Labor Organization's rate for international comparisons; Germany's Federal Employment Agency reported an annual average unemployment rate of 7.1% for 2011 and 7.7% for 2010.

Unemployment, youth ages 15-24


total: 11%
male: 12%
female: 9.8% (2009)

Household income or consumption by percentage share


lowest 10%: 3.6%
highest 10%: 24% (2000)

Distribution of family income - Gini index


27 (2006)
30 (1994)

Investment (gross fixed)


18.2% of GDP (2011 est.)

Budget


revenues: $1.551 trillion
expenditures: $1.588 trillion (2011 est.)

Taxes and other revenues


43.6% of GDP (2011 est.)

Budget surplus (+) or deficit (-)


-1.7% of GDP (2011 est.)

Public debt


81.5% of GDP (2011 est.)
83.4% of GDP (2010 est.)
note: general government gross debt is defined in the Maastricht Treaty as consolidated general government gross debt at nominal value, outstanding at the end of the year in the following categories of government liabilities (as defined in ESA95): currency and deposits (AF.2), securities other than shares excluding financial derivatives (AF.3, excluding AF.34), and loans (AF.4); the general government sector comprises the sub-sectors of central government, state government, local government and social security funds; the series are presented as a percentage of GDP and in millions of euro; GDP used as a denominator is the gross domestic product at current market prices; data expressed in national currency are converted into euro using end-year exchange rates provided by the European Central Bank

Inflation rate (consumer prices)


2.2% (2011 est.)
1.1% (2010 est.)

Central bank discount rate


1.75% (31 December 2011)
1.75% (31 December 2010)
note: this is the European Central Bank's rate on the marginal lending facility, which offers overnight credit to banks in the euro area

Commercial bank prime lending rate


8.4% (31 December 2011 est.)
4.96% (31 December 2009 est.)

Stock of narrow money


$1.831 trillion (31 December 2011 est.)
$1.747 trillion (31 December 2010 est.)
note: see entry for the European Union for money supply in the euro area; the European Central Bank (ECB) controls monetary policy for the 17 members of the Economic and Monetary Union (EMU); individual members of the EMU do not control the quantity of money circulating within their own borders

Stock of money


$NA
note: see entry for the European Union for money supply in the euro area; the European Central Bank (ECB) controls monetary policy for the 16 members of the Economic and Monetary Union (EMU); individual members of the EMU do not control the quantity of money and quasi money circulating within their own borders

Stock of quasi money


$NA

Stock of broad money


$4.437 trillion (31 December 2011 est.)
$4.173 trillion (31 December 2010 est.)

Stock of domestic credit


$4.689 trillion (31 December 2011 est.)
$5.2 trillion (31 December 2009 est.)

Market value of publicly traded shares


$1.43 trillion (31 December 2010)
$1.298 trillion (31 December 2009)
$1.108 trillion (31 December 2008)

Agriculture - products


potatoes, wheat, barley, sugar beets, fruit, cabbages; cattle, pigs, poultry

Industries


among the world's largest and most technologically advanced producers of iron, steel, coal, cement, chemicals, machinery, vehicles, machine tools, electronics, food and beverages, shipbuilding, textiles

Industrial production growth rate


8% (2011 est.)

Electricity - production


556.4 billion kWh (2009 est.)

Electricity - production by source


fossil fuel: 61.8%
hydro: 4.2%
nuclear: 29.9%
other: 4.1% (2001)

Electricity - consumption


544.5 billion kWh (2008 est.)

Electricity - exports


54.13 billion kWh (2009 est.)

Electricity - imports


12.28 billion kWh (2009 est.)

Oil - production


147,200 bbl/day (2010 est.)

Oil - consumption


2.495 million bbl/day (2010 est.)

Oil - exports


470,200 bbl/day (2009 est.)

Oil - imports


2.671 million bbl/day (2009 est.)

Oil - proved reserves


276 million bbl (1 January 2011 est.)

Natural gas - production


12.65 billion cu m (2010 est.)

Natural gas - consumption


99.5 billion cu m (2010 est.)

Natural gas - exports


16.19 billion cu m (2010 est.)

Natural gas - imports


99.63 billion cu m (2010 est.)

Natural gas - proved reserves


175.6 billion cu m (1 January 2011 est.)

Current Account Balance


$149.3 billion (2011 est.)
$188.4 billion (2010 est.)

Exports


$1.408 trillion (2011 est.)
$1.264 trillion (2010 est.)

Exports - commodities


motor vehicles, machinery, chemicals, computer and electronic products, electrical equipment, pharmaceuticals, metals, transport equipment, foodstuffs, textiles, rubber and plastic products

Exports - partners


France 9.4%, US 6.8%, Netherlands 6.6%, UK 6.2%, Italy 6.2%, China 5.7%, Austria 5.5%, Belgium 4.7%, Switzerland 4.4% (2009 est.)

Imports


$1.198 trillion (2011 est.)
$1.058 trillion (2010 est.)

Imports - commodities


machinery, data processing equipment, vehicles, chemicals, oil and gas, metals, electric equipment, pharmaceuticals, foodstuffs, agricultural products

Imports - partners


China 9.7%, Netherlands 8.4%, France 7.6%, US 5.7%, Italy 5.2%, UK 4.7%, Belgium 4.2%, Austria 4.1%, Switzerland 4.1% (2009 est.)

Reserves of foreign exchange and gold


$216.5 billion (31 December 2010 est.)

Debt - external


$5.624 trillion (30 June 2011)
$4.713 trillion (30 June 2010)

Stock of direct foreign investment - at home


$998.1 billion (31 December 2011 est.)
$956.6 billion (31 December 2010 est.)

Stock of direct foreign investment - abroad


$1.486 trillion (31 December 2011 est.)
$1.427 trillion (31 December 2010 est.)

Ukraine Economy Profile 2012


After Russia, the Ukrainian republic was the most important economic component of the former Soviet Union, producing about four times the output of the next-ranking republic. Its fertile black soil generated more than one-fourth of Soviet agricultural output, and its farms provided substantial quantities of meat, milk, grain, and vegetables to other republics. Likewise, its diversified heavy industry supplied the unique equipment (for example, large diameter pipes) and raw materials to industrial and mining sites (vertical drilling apparatus) in other regions of the former USSR. Shortly after independence in August 1991, the Ukrainian Government liberalized most prices and erected a legal framework for privatization, but widespread resistance to reform within the government and the legislature soon stalled reform efforts and led to some backtracking. Output by 1999 had fallen to less than 40% of the 1991 level. Ukraine's dependence on Russia for energy supplies and the lack of significant structural reform have made the Ukrainian economy vulnerable to external shocks. Ukraine depends on imports to meet about three-fourths of its annual oil and natural gas requirements and 100% of its nuclear fuel needs. After a two-week dispute that saw gas supplies cutoff to Europe, Ukraine agreed to 10-year gas supply and transit contracts with Russia in January 2009 that brought gas prices to "world" levels. The strict terms of the contracts have further hobbled Ukraine's cash-strapped state gas company, Naftohaz. Outside institutions - particularly the IMF - have encouraged Ukraine to quicken the pace and scope of reforms. Ukrainian Government officials eliminated most tax and customs privileges in a March 2005 budget law, bringing more economic activity out of Ukraine's large shadow economy, but more improvements are needed, including fighting corruption, developing capital markets, and improving the legislative framework. Ukraine's economy was buoyant despite political turmoil between the prime minister and president until mid-2008. Real GDP growth exceeded 7% in 2006-07, fueled by high global prices for steel - Ukraine's top export - and by strong domestic consumption, spurred by rising pensions and wages. A drop in steel prices and Ukraine's exposure to the global financial crisis due to aggressive foreign borrowing lowered growth in 2008. Ukraine reached an agreement with the IMF for a $16.4 billion Stand-By Arrangement in November 2008 to deal with the economic crisis, but the program quickly stalled due to the Ukrainian Government's lack of progress in implementing reforms. The economy contracted nearly 15% in 2009, among the worst economic performances in the world. In April 2010, Ukraine negotiated a price discount on Russian gas imports in exchange for extending Russia's lease on its naval base in Crimea. In August 2010, Ukraine, under the YANUKOVYCH Administration, reached a new agreement with the IMF for a $15.1 billion Stand-By Agreement to put the country on the path to fiscal sustainability, reform the gas sector, and shore up the country's banking system. Economic growth resumed in 2010 and 2011, buoyed by exports. After initial disbursements, the IMF program stalled in early 2011 due to the Ukrainian Government's lack of progress in implementing key gas sector reforms, namely gas tariff increases.

GDP (purchasing power parity)


$329 billion (2011 est.)
$312.7 billion (2010 est.)
$300.2 billion (2009 est.)
note: data are in 2011 US dollars

GDP (official exchange rate)


$162.9 billion (2011 est.)

GDP - real growth rate


5.2% (2011 est.)
4.2% (2010 est.)
-14.5% (2009 est.)

GDP - per capita (PPP)


$7,200 (2011 est.)
$6,800 (2010 est.)
$6,500 (2009 est.)
note: data are in 2011 US dollars

GDP - composition by sector


agriculture: 9.4%
industry: 34.4%
services: 56.2% (2011 est.)

Population below poverty line


35% (2009)

Labor force


22.09 million (2011 est.)

Labor force - by occupation


agriculture: 15.8%
industry: 18.5%
services: 65.7% (2008)

Unemployment rate


7% (2011 est.)
8.1% (2010 est.)
note: officially registered; large number of unregistered or underemployed workers

Unemployment, youth ages 15-24


total: 14.9%
male: 15.2%
female: 14.5% (2005)

Household income or consumption by percentage share


lowest 10%: 4.1%
highest 10%: 22.6% (2008)

Distribution of family income - Gini index


27.5 (2008)
29 (1999)

Investment (gross fixed)


20% of GDP (2011 est.)

Budget


revenues: $49.99 billion
expenditures: $56.39 billion
note: this is the planned, consolidated budget (2011 est.)

Taxes and other revenues


26.9% of GDP (2011 est.)

Budget surplus (+) or deficit (-)


-4% of GDP (2011 est.)

Public debt


44.8% of GDP (2011 est.)
42.3% of GDP (2010 est.)

Inflation rate (consumer prices)


9% (2011 est.)
9.4% (2010 est.)

Central bank discount rate


11.97% (31 December 2010 est.)
10.25% (31 December 2009 est.)

Commercial bank prime lending rate


15% (31 December 2011 est.)
15.869% (31 December 2010 est.)

Stock of money


$24.7 billion (31 December 2009)
$29.24 billion (31 December 2008)

Stock of narrow money


$43.42 billion (31 December 2011 est.)
$36.41 billion (31 December 2010 est.)

Stock of quasi money


$41.5 billion (31 December 2009)
$45.3 billion (31 December 2008)

Stock of broad money


$90.27 billion (31 December 2011 est.)
$74.96 billion (31 December 2010 est.)

Stock of domestic credit


$123.2 billion (31 December 2011 est.)
$108.1 billion (31 December 2010 est.)

Market value of publicly traded shares


$39.46 billion (31 December 2010)
$16.79 billion (31 December 2009)
$24.36 billion (31 December 2008)

Agriculture - products


grain, sugar beets, sunflower seeds, vegetables; beef, milk

Industries


coal, electric power, ferrous and nonferrous metals, machinery and transport equipment, chemicals, food processing

Industrial production growth rate


7.6% (2011 est.)

Electricity - production


172.9 billion kWh (2009 est.)

Electricity - production by source


fossil fuel: 48.6%
hydro: 7.9%
nuclear: 43.5%
other: 0% (2001)

Electricity - consumption


134.6 billion kWh (2009 est.)

Electricity - exports


4 billion kWh (2009 est.)

Electricity - imports


6.73 billion kWh (2008 est.)

Oil - production


82,000 bbl/day (2010 est.)

Oil - consumption


296,000 bbl/day (2010 est.)

Oil - exports


114,000 bbl/day (2009 est.)

Oil - imports


301,900 bbl/day (2009 est.)

Oil - proved reserves


395 million bbl (1 January 2011 est.)

Natural gas - production


20.26 billion cu m (2009 est.)

Natural gas - consumption


44.16 billion cu m (2009 est.)

Natural gas - exports


2.8 billion cu m (2009 est.)

Natural gas - imports


26.7 billion cu m (2009 est.)

Natural gas - proved reserves


1.104 trillion cu m (1 January 2011 est.)

Current Account Balance


-$5.695 billion (2011 est.)
-$2.884 billion (2010 est.)

Exports


$60.67 billion (2011 est.)
$52.19 billion (2010 est.)

Exports - commodities


ferrous and nonferrous metals, fuel and petroleum products, chemicals, machinery and transport equipment, food products

Exports - partners


Russia 24.1%, Turkey 5.9%, Italy 4.7% (2009 est.)

Imports


$72.08 billion (2011 est.)
$60.9 billion (2010 est.)

Imports - commodities


energy, machinery and equipment, chemicals

Imports - partners


Russia 33.9%, China 8.5%, Germany 8.1%, Poland 5.4%, Belarus 4.1% (2009 est.)

Reserves of foreign exchange and gold


$38.13 billion (31 December 2011 est.)
$34.58 billion (31 December 2010 est.)

Debt - external


$111.7 billion (31 December 2011 est.)
$99.51 billion (31 December 2010 est.)

Stock of direct foreign investment - at home


$59.3 billion (31 December 2011 est.)
$53.3 billion (31 December 2010 est.)

Stock of direct foreign investment - abroad


$3.203 billion (31 December 2011 est.)
$2.803 billion (31 December 2010 est.)

Economy - overview


France was transitioning from an economy that has featured extensive government ownership and intervention to one that relies more on market mechanisms but is in the midst of a euro-zone crisis. The government has partially or fully privatized many large companies, banks, and insurers, and has ceded stakes in such leading firms as Air France, France Telecom, Renault, and Thales. It maintains a strong presence in some sectors, particularly power, public transport, and defense industries. With at least 75 million foreign tourists per year, France is the most visited country in the world and maintains the third largest income in the world from tourism. France's leaders remain committed to a capitalism in which they maintain social equity by means of laws, tax policies, and social spending that reduce income disparity and the impact of free markets on public health and welfare. France's real GDP contracted 2.6% in 2009, but recovered somewhat in 2010 and 2011. The unemployment rate increased from 7.4% in 2008 to 9.3% in 2010 and 9.1% in 2011. Lower-than-expected growth and increased unemployment have cut government revenues and increased borrowing costs, contributing to a deterioration of France's public finances. The government budget deficit rose sharply from 3.4% of GDP in 2008 to 7.5% of GDP in 2009 before improving to 5.8% of GDP in 2011, while France's public debt rose from 68% of GDP to 86% over the same period. Under President SARKOZY, Paris implemented austerity measures that eliminated tax credits and froze most government spending in an effort to bring the budget deficit under the 3% euro-zone ceiling by 2013 and to highlight France's commitment to fiscal discipline at a time of intense financial market scrutiny of euro-zone debt levels. Socialist Francois HOLLANDE won the May 2012 presidential election, after advocating pro-growth economic policies, as well as measures such as forcing banks to separate their traditional deposit taking and lending activities from more speculative businesses, increasing taxes on bank profits, introducing a new top bracket on income taxes for people earning over ?1 million ($1.3 million) a year, and hiring an additional 60,000 civil servants during his five-year term of office.

GDP (purchasing power parity)


$2.214 trillion (2011 est.)
$2.178 trillion (2010 est.)
$2.148 trillion (2009 est.)
note: data are in 2011 US dollars

GDP (official exchange rate)


$2.808 trillion (2011 est.)

GDP - real growth rate


1.7% (2011 est.)
1.4% (2010 est.)
-2.6% (2009 est.)

GDP - per capita (PPP)


$35,000 (2011 est.)
$34,600 (2010 est.)
$34,300 (2009 est.)
note: data are in 2011 US dollars

GDP - composition by sector


agriculture: 1.8%
industry: 18.8%
services: 79.4% (2011 est.)

Population below poverty line


6.2% (2004)

Labor force


29.61 million (2011 est.)

Labor force - by occupation


agriculture: 3.8%
industry: 24.3%
services: 71.8% (2005)

Unemployment rate


9.3% (2011 est.)
9.3% (2010 est.)

Unemployment, youth ages 15-24


total: 22.6%
male: 23.4%
female: 21.7% (2009)

Household income or consumption by percentage share


lowest 10%: 3%
highest 10%: 24.8% (2004)

Distribution of family income - Gini index


32.7 (2008)
32.7 (1995)

Investment (gross fixed)


19.8% of GDP (2011 est.)

Budget


revenues: $1.386 trillion
expenditures: $1.535 trillion (2011 est.)

Taxes and other revenues


49.2% of GDP (2011 est.)

Budget surplus (+) or deficit (-)


-5.8% of GDP (2011 est.)

Public debt


85.5% of GDP (2011 est.)
82.4% of GDP (2010 est.)
note: data cover general government debt, and includes debt instruments issued (or owned) by government entities other than the treasury; the data include treasury debt held by foreign entities; the data include debt issued by subnational entities, as well as intra-governmental debt; intra-governmental debt consists of treasury borrowings from surpluses in the social funds, such as for retirement, medical care, and unemployment; debt instruments for the social funds are not sold at public auctions

Inflation rate (consumer prices)


2% (2011 est.)
1.7% (2010 est.)

Central bank discount rate


1.75% (31 December 2011)
1.75% (31 December 2010)
note: this is the European Central Bank's rate on the marginal lending facility, which offers overnight credit to banks in the euro area

Commercial bank prime lending rate


3.6% (31 December 2011 est.)
3.373% (31 December 2010 est.)

Stock of money


$NA
note: see entry for the European Union for money supply in the euro area; the European Central Bank (ECB) controls monetary policy for the 16 members of the Economic and Monetary Union (EMU); individual members of the EMU do not control the quantity of money and quasi money circulating within their own borders

Stock of narrow money


$951.3 billion (31 December 2011 est.)
$887.3 billion (31 December 2010 est.)
note: see entry for the European Union for money supply in the euro area; the European Central Bank (ECB) controls monetary policy for the 17 members of the Economic and Monetary Union (EMU); individual members of the EMU do not control the quantity of money circulating within their own borders

Stock of broad money


$2.62 trillion (30 October 2011 est.)
$2.336 trillion (31 December 2010 est.)

Stock of quasi money


$NA

Stock of domestic credit


$4.319 trillion (31 December 2009 est.)
$4.121 trillion (31 December 2008 est.)

Market value of publicly traded shares


$1.926 trillion (31 December 2010)
$1.972 trillion (31 December 2009)
$1.492 trillion (31 December 2008)

Agriculture - products


wheat, cereals, sugar beets, potatoes, wine grapes; beef, dairy products; fish

Industries


machinery, chemicals, automobiles, metallurgy, aircraft, electronics; textiles, food processing; tourism

Industrial production growth rate


2.4% (2011 est.)

Electricity - production


510 billion kWh (2009 est.)

Electricity - production by source


fossil fuel: 8.2%
hydro: 14%
nuclear: 77.1%
other: 0.7% (2001)

Electricity - consumption


460.9 billion kWh (2008 est.)

Electricity - exports


44.91 billion kWh (2009 est.)

Electricity - imports


25.7 billion kWh (2009 est.)

Oil - production


84,820 bbl/day (2010 est.)

Oil - consumption


1.861 million bbl/day (2010 est.)

Oil - exports


487,200 bbl/day (2009 est.)

Oil - imports


2.22 million bbl/day (2009 est.)

Oil - proved reserves


91.63 million bbl (1 January 2011 est.)

Natural gas - production


721 million cu m (2010 est.)

Natural gas - consumption


49.78 billion cu m (2010 est.)

Natural gas - exports


2.945 billion cu m (2010 est.)

Natural gas - imports


46.2 billion cu m (2010 est.)

Natural gas - proved reserves


6.796 billion cu m (1 January 2011 est.)

Current Account Balance


-$74.3 billion (2011 est.)
-$44.5 billion (2010 est.)

Exports


$578.4 billion (2011 est.)
$517.2 billion (2010 est.)

Exports - commodities


machinery and transportation equipment, aircraft, plastics, chemicals, pharmaceutical products, iron and steel, beverages

Exports - partners


Germany 16.4%, Italy 8.2%, Belgium 7.7%, Spain 7.6%, UK 6.8%, US 5.1%, Netherlands 4.2% (2009)

Imports


$684.6 billion (2011 est.)
$588.4 billion (2010 est.)

Imports - commodities


machinery and equipment, vehicles, crude oil, aircraft, plastics, chemicals

Imports - partners


Germany 19.3%, Belgium 11.4%, Italy 8%, Netherlands 7.5%, Spain 6.8%, China 5.1%, UK 5% (2009)

Reserves of foreign exchange and gold


$166.2 billion (31 December 2010 est.)

Debt - external


$5.633 trillion (30 June 2011)
$4.698 trillion (30 June 2010)

Stock of direct foreign investment - at home


$1.186 trillion (31 December 2011 est.)
$1.161 trillion (31 December 2010 est.)

Stock of direct foreign investment - abroad


$1.787 trillion (31 December 2011 est.)
$1.746 trillion (31 December 2010 est.)

Spain Economy Profile 2012


spain's mixed capitalist economy is the 13th largest in the world, and its per capita income roughly matches that of Germany and France. However, after almost 15 years of above average GDP growth, the Spanish economy began to slow in late 2007 and entered into a recession in the second quarter of 2008. GDP contracted by 3.7% in 2009, ending a 16-year growth trend, and by another 0.1% in 2010, before turning positive in 2011, making Spain the last major economy to emerge from the global recession. The reversal in Spain''s economic growth reflected a significant decline in construction amid an oversupply of housing and falling consumer spending, while exports actually have begun to grow. Government efforts to boost the economy through stimulus spending, extended unemployment benefits, and loan guarantees did not prevent a sharp rise in the unemployment rate, which rose from a low of about 8% in 2007 to over 20% in 2011. The government budget deficit worsened from 3.8% of GDP in 2008 to 9.2% of GDP in 2010, more than three times the euro-zone limit. Madrid cut the deficit to 8.5% of GDP in 2011, a larger deficit than the 6% target negotiated between Spain and the EU. Spain''s large budget deficit and poor economic growth prospects have made it vulnerable to financial contagion from other highly-indebted euro zone members despite the government''s efforts to cut spending, privatize industries, and boost competitiveness through labor market reforms. Spanish banks'' high exposure to the collapsed domestic construction and real estate market also poses a continued risk for the sector. The government oversaw a restructuring of the savings bank sector in 2010, and provided some $15 billion in capital to various institutions. Investors remain concerned that Madrid may need to bail out more troubled banks. The Bank of Spain, however, is seeking to boost confidence in the financial sector by pressuring banks to come clean about their losses and consolidate into stronger groups.

GDP (purchasing power parity)


$1.411 trillion (2011 est.)
$1.4 trillion (2010 est.)
$1.402 trillion (2009 est.)
note: data are in 2011 US dollars

GDP (official exchange rate)


$1.537 trillion (2011 est.)

GDP - real growth rate


0.8% (2011 est.)
-0.1% (2010 est.)
-3.7% (2009 est.)

GDP - per capita (PPP)


$30,600 (2011 est.)
$30,400 (2010 est.)
$30,600 (2009 est.)
note: data are in 2011 US dollars

GDP - composition by sector


agriculture: 3.2%
industry: 25.8%
services: 71% (2011 est.)

Population below poverty line


19.8% (2005)

Labor force


23.1 million (2011 est.)

Labor force - by occupation


agriculture: 4.2%
industry: 24%
services: 71.7% (2009 est.)

Unemployment rate


21.7% (2011 est.)
20.1% (2010 est.)

Unemployment, youth ages 15-24


total: 37.9%
male: 39.1%
female: 36.4% (2009)

Household income or consumption by percentage share


lowest 10%: 2.6%
highest 10%: 26.6% (2000)

Distribution of family income - Gini index


32 (2005)
32.5 (1990)

Investment (gross fixed)


21.7% of GDP (2011 est.)

Budget


revenues: $545.2 billion
expenditures: $675.8 billion (2011 est.)

Taxes and other revenues


36.5% of GDP (2011 est.)

Budget surplus (+) or deficit (-)


-8.5% of GDP (2011 est.)

Public debt


68.2% of GDP (2011 est.)
60.1% of GDP (2010 est.)

Inflation rate (consumer prices)


3.1% (2011 est.)
2% (2010 est.)

Central bank discount rate


1.75% (31 December 2011)
1.75% (31 December 2010)
note: this is the European Central Bank's rate on the marginal lending facility, which offers overnight credit to banks in the euro area

Commercial bank prime lending rate


8.3% (31 December 2011 est.)
7.223% (31 December 2010 est.)

Stock of narrow money


$832.6 billion (31 December 2011 est.)
$811.2 billion (31 December 2010 est.)
note: see entry for the European Union for money supply in the euro area; the European Central Bank (ECB) controls monetary policy for the 17 members of the Economic and Monetary Union (EMU); individual members of the EMU do not control the quantity of money circulating within their own borders

Stock of money


$NA
note: see entry for the European Union for money supply in the euro area; the European Central Bank (ECB) controls monetary policy for the 16 members of the Economic and Monetary Union (EMU); individual members of the EMU do not control the quantity of money and quasi money circulating within their own borders

Stock of quasi money


$NA

Stock of broad money


$2.488 trillion (31 December 2011 est.)
$2.388 trillion (31 December 2010 est.)

Stock of domestic credit


$3.683 trillion (31 December 2009 est.)
$3.451 trillion (31 December 2008 est.)

Market value of publicly traded shares


$1.172 trillion (31 December 2010)
$1.297 trillion (31 December 2009)
$946.1 billion (31 December 2008)

Agriculture - products


grain, vegetables, olives, wine grapes, sugar beets, citrus; beef, pork, poultry, dairy products; fish

Industries


textiles and apparel (including footwear), food and beverages, metals and metal manufactures, chemicals, shipbuilding, automobiles, machine tools, tourism, clay and refractory products, footwear, pharmaceuticals, medical equipment

Industrial production growth rate


-1.4% (2011 est.)

Electricity - production


275.1 billion kWh (2009 est.)

Electricity - production by source


fossil fuel: 50.4%
hydro: 18.2%
nuclear: 27.2%
other: 4.1% (2001)

Electricity - consumption


267.5 billion kWh (2008 est.)

Electricity - exports


14.86 billion kWh (2009 est.)

Electricity - imports


8.104 billion kWh (2009 est.)

Oil - production


29,970 bbl/day (2010 est.)

Oil - consumption


1.441 million bbl/day (2010 est.)

Oil - exports


240,700 bbl/day (2009 est.)

Oil - imports


1.584 million bbl/day (2009 est.)

Oil - proved reserves


150 million bbl (1 January 2011 est.)

Natural gas - production


48 million cu m (2010 est.)

Natural gas - consumption


35.82 billion cu m (2010 est.)

Natural gas - exports


1.152 billion cu m (2010 est.)

Natural gas - imports


36.71 billion cu m (2010 est.)

Natural gas - proved reserves


2.548 billion cu m (1 January 2011 est.)

Current Account Balance


-$60.9 billion (2011 est.)
-$64.34 billion (2010 est.)

Exports


$330.6 billion (2011 est.)
$253 billion (2010 est.)

Exports - commodities


machinery, motor vehicles; foodstuffs, pharmaceuticals, medicines, other consumer goods

Exports - partners


France 18.7%, Germany 10.7%, Portugal 9.1%, Italy 9%, UK 6.3% (2009)

Imports


$384.6 billion (2011 est.)
$315.3 billion (2010 est.)

Imports - commodities


machinery and equipment, fuels, chemicals, semifinished goods, foodstuffs, consumer goods, measuring and medical control instruments

Imports - partners


Germany 12.6%, France 11.5%, Italy 7.3%, China 6.8%, Netherlands 5.6%, UK 4.9% (2009)

Reserves of foreign exchange and gold


$31.91 billion (31 December 2010 est.)
$28.2 billion (31 December 2009 est.)

Debt - external


$2.57 trillion (30 June 2011)
$2.166 trillion (30 June 2010)

Stock of direct foreign investment - at home


$634.2 billion (31 December 2011 est.)
$614.5 billion (31 December 2010 est.)

Stock of direct foreign investment - abroad


$678.7 billion (31 December 2011 est.)
$660.2 billion (31 December 2010 est.)

United Kingdom Economy Profile 2012


The UK, a leading trading power and financial center, is the third largest economy in Europe after Germany and France. Over the past two decades, the government has greatly reduced public ownership and contained the growth of social welfare programs. Agriculture is intensive, highly mechanized, and efficient by European standards, producing about 60% of food needs with less than 2% of the labor force. The UK has large coal, natural gas, and oil resources, but its oil and natural gas reserves are declining and the UK became a net importer of energy in 2005. Services, particularly banking, insurance, and business services, account by far for the largest proportion of GDP while industry continues to decline in importance. After emerging from recession in 1992, Britain's economy enjoyed the longest period of expansion on record during which time growth outpaced most of Western Europe. In 2008, however, the global financial crisis hit the economy particularly hard, due to the importance of its financial sector. Sharply declining home prices, high consumer debt, and the global economic slowdown compounded Britain's economic problems, pushing the economy into recession in the latter half of 2008 and prompting the then BROWN (Labour) government to implement a number of measures to stimulate the economy and stabilize the financial markets; these include nationalizing parts of the banking system, temporarily cutting taxes, suspending public sector borrowing rules, and moving forward public spending on capital projects. Facing burgeoning public deficits and debt levels, in 2010 the CAMERON-led coalition government (between Conservatives and Liberal Democrats) initiated a five-year austerity program, which aims to lower London's budget deficit from over 10% of GDP in 2010 to nearly 1% by 2015. In November 2011, Chancellor of the Exchequer George OSBORNE announced additional austerity measures through 2017 because of slower-than-expected economic growth and the impact of the euro-zone debt crisis. The CAMERON government raised the value added tax from 17.5% to 20% in 2011. It has pledged to reduce the corporation tax rate to 23% by 2015. The Bank of England (BoE) implemented an asset purchase program of up to ?325 billion (approximately $525 billion) as of February 2011. During times of economic crisis, the BoE coordinates interest rate moves with the European Central Bank, but Britain remains outside the European Economic and Monetary Union (EMU).

GDP (purchasing power parity)


$2.25 trillion (2011 est.)
$2.225 trillion (2010 est.)
$2.195 trillion (2009 est.)
note: data are in 2011 US dollars

GDP (official exchange rate)


$2.481 trillion (2011 est.)

GDP - real growth rate


1.1% (2011 est.)
1.4% (2010 est.)
-4.4% (2009)

GDP - per capita (PPP)


$35,900 (2011 est.)
$35,800 (2010 est.)
$35,500 (2009 est.)
note: data are in 2011 US dollars

GDP - composition by sector


agriculture: 0.7%
industry: 21.4%
services: 77.8% (2011 est.)

Population below poverty line


14% (2006 est.)

Labor force


31.73 million (2011 est.)

Labor force - by occupation


agriculture: 1.4%
industry: 18.2%
services: 80.4% (2006 est.)

Unemployment rate


8.1% (2011 est.)
7.8% (2010 est.)

Unemployment, youth ages 15-24


total: 18.9%
male: 21.7%
female: 15.6% (2009)

Household income or consumption by percentage share


lowest 10%: 2.1%
highest 10%: 28.5% (1999)

Distribution of family income - Gini index


34 (2005)
36.8 (1999)

Investment (gross fixed)


14.3% of GDP (2011 est.)

Budget


revenues: $986.5 billion
expenditures: $1.188 trillion (2011 est.)

Taxes and other revenues


40.9% of GDP (2011 est.)

Budget surplus (+) or deficit (-)


-8.8% of GDP (2011 est.)

Public debt


79.5% of GDP (2011 est.)
76.1% of GDP (2010 est.)
note: data cover general government debt, and includes debt instruments issued (or owned) by government entities other than the treasury; the data include treasury debt held by foreign entities; the data include debt issued by subnational entities, as well as intra-governmental debt; intra-governmental debt consists of treasury borrowings from surpluses in the social funds, such as for retirement, medical care, and unemployment. Debt instruments for the social funds are not sold at public auctions.

Inflation rate (consumer prices)


4.5% (2011 est.)
3.3% (2010 est.)

Central bank discount rate


7.75% (31 December 2010 est.)
0.5% (31 December 2009 est.)

Commercial bank prime lending rate


4% (31 December 2011 est.)
3.962% (31 December 2010 est.)

Stock of money


$NA

Stock of narrow money


$96.55 billion (31 December 2011 est.)
$88.88 billion (31 December 2010 est.)

Stock of quasi money


$NA

Stock of broad money


$3.53 trillion (31 December 2011 est.)
$3.362 trillion (31 December 2010 est.)

Stock of domestic credit


$5.151 trillion (31 December 2009)
$4.436 trillion (31 December 2008)

Market value of publicly traded shares


$3.107 trillion (31 December 2010)
$2.796 trillion (31 December 2009)
$1.852 trillion (31 December 2008)

Agriculture - products


cereals, oilseed, potatoes, vegetables; cattle, sheep, poultry; fish

Industries


machine tools, electric power equipment, automation equipment, railroad equipment, shipbuilding, aircraft, motor vehicles and parts, electronics and communications equipment, metals, chemicals, coal, petroleum, paper and paper products, food processing, textiles, clothing, other consumer goods

Industrial production growth rate


-1.2% (2011 est.)

Electricity - production


346 billion kWh (2009 est.)

Electricity - production by source


fossil fuel: 73.8%
hydro: 0.9%
nuclear: 23.7%
other: 1.6% (2001)

Electricity - consumption


344.7 billion kWh (2008 est.)

Electricity - exports


3.748 billion kWh (2009 est.)

Electricity - imports


2.861 billion kWh (2009 est.)

Oil - production


1.393 million bbl/day (2010 est.)

Oil - consumption


1.622 million bbl/day (2010 est.)

Oil - exports


1.311 million bbl/day (2009 est.)

Oil - imports


1.45 million bbl/day (2009 est.)

Oil - proved reserves


2.858 billion bbl (1 January 2011 est.)

Natural gas - production


56.3 billion cu m (2010 est.)

Natural gas - consumption


94.28 billion cu m (2010 est.)

Natural gas - exports


15.65 billion cu m (2010 est.)

Natural gas - imports


53.63 billion cu m (2010 est.)

Natural gas - proved reserves


256 billion cu m (1 January 2011 est.)

Current Account Balance


-$66.6 billion (2011 est.)
-$71.6 billion (2010 est.)

Exports


$495.4 billion (2011 est.)
$410.2 billion (2010 est.)

Exports - commodities


manufactured goods, fuels, chemicals; food, beverages, tobacco

Exports - partners


US 11.4%, Germany 11.2%, Netherlands 8.5%, France 7.7%, Ireland 6.8%, Belgium 5.4% (2009)

Imports


$654.9 billion (2011 est.)
$563.2 billion (2010 est.)

Imports - commodities


manufactured goods, machinery, fuels; foodstuffs

Imports - partners


Germany 13.1%, China 9.1%, Netherlands 7.5%, France 6.1%, US 5.8%, Norway 5.5%, Belgium 4.9% (2009)

Reserves of foreign exchange and gold


$82.41 billion (31 December 2010 est.)
$66.72 billion (31 December 2009 est.)

Debt - external


$9.836 trillion (30 June 2011)
$8.981 trillion (30 June 2010)

Stock of direct foreign investment - at home


$1.136 trillion (31 December 2011 est.)
$1.076 trillion (31 December 2010 est.)

Stock of direct foreign investment - abroad


$1.702 trillion (31 December 2011 est.)
$1.675 trillion (31 December 2010 est.)

France Economy Profile 2012


France was transitioning from an economy that has featured extensive government ownership and intervention to one that relies more on market mechanisms but is in the midst of a euro-zone crisis. The government has partially or fully privatized many large companies, banks, and insurers, and has ceded stakes in such leading firms as Air France, France Telecom, Renault, and Thales. It maintains a strong presence in some sectors, particularly power, public transport, and defense industries. With at least 75 million foreign tourists per year, France is the most visited country in the world and maintains the third largest income in the world from tourism. France's leaders remain committed to a capitalism in which they maintain social equity by means of laws, tax policies, and social spending that reduce income disparity and the impact of free markets on public health and welfare. France's real GDP contracted 2.6% in 2009, but recovered somewhat in 2010 and 2011. The unemployment rate increased from 7.4% in 2008 to 9.3% in 2010 and 9.1% in 2011. Lower-than-expected growth and increased unemployment have cut government revenues and increased borrowing costs, contributing to a deterioration of France's public finances. The government budget deficit rose sharply from 3.4% of GDP in 2008 to 7.5% of GDP in 2009 before improving to 5.8% of GDP in 2011, while France's public debt rose from 68% of GDP to 86% over the same period. Under President SARKOZY, Paris implemented austerity measures that eliminated tax credits and froze most government spending in an effort to bring the budget deficit under the 3% euro-zone ceiling by 2013 and to highlight France's commitment to fiscal discipline at a time of intense financial market scrutiny of euro-zone debt levels. Socialist Francois HOLLANDE won the May 2012 presidential election, after advocating pro-growth economic policies, as well as measures such as forcing banks to separate their traditional deposit taking and lending activities from more speculative businesses, increasing taxes on bank profits, introducing a new top bracket on income taxes for people earning over ?1 million ($1.3 million) a year, and hiring an additional 60,000 civil servants during his five-year term of office.

GDP (purchasing power parity)


$2.214 trillion (2011 est.)
$2.178 trillion (2010 est.)
$2.148 trillion (2009 est.)
note: data are in 2011 US dollars

GDP (official exchange rate)


$2.808 trillion (2011 est.)

GDP - real growth rate


1.7% (2011 est.)
1.4% (2010 est.)
-2.6% (2009 est.)

GDP - per capita (PPP)


$35,000 (2011 est.)
$34,600 (2010 est.)
$34,300 (2009 est.)
note: data are in 2011 US dollars

GDP - composition by sector


agriculture: 1.8%
industry: 18.8%
services: 79.4% (2011 est.)

Population below poverty line


6.2% (2004)

Labor force


29.61 million (2011 est.)

Labor force - by occupation


agriculture: 3.8%
industry: 24.3%
services: 71.8% (2005)

Unemployment rate


9.3% (2011 est.)
9.3% (2010 est.)

Unemployment, youth ages 15-24


total: 22.6%
male: 23.4%
female: 21.7% (2009)

Household income or consumption by percentage share


lowest 10%: 3%
highest 10%: 24.8% (2004)

Distribution of family income - Gini index


32.7 (2008)
32.7 (1995)

Investment (gross fixed)


19.8% of GDP (2011 est.)

Budget


revenues: $1.386 trillion
expenditures: $1.535 trillion (2011 est.)

Taxes and other revenues


49.2% of GDP (2011 est.)

Budget surplus (+) or deficit (-)


-5.8% of GDP (2011 est.)

Public debt


85.5% of GDP (2011 est.)
82.4% of GDP (2010 est.)
note: data cover general government debt, and includes debt instruments issued (or owned) by government entities other than the treasury; the data include treasury debt held by foreign entities; the data include debt issued by subnational entities, as well as intra-governmental debt; intra-governmental debt consists of treasury borrowings from surpluses in the social funds, such as for retirement, medical care, and unemployment; debt instruments for the social funds are not sold at public auctions

Inflation rate (consumer prices)


2% (2011 est.)
1.7% (2010 est.)

Central bank discount rate


1.75% (31 December 2011)
1.75% (31 December 2010)
note: this is the European Central Bank's rate on the marginal lending facility, which offers overnight credit to banks in the euro area

Commercial bank prime lending rate


3.6% (31 December 2011 est.)
3.373% (31 December 2010 est.)

Stock of money


$NA
note: see entry for the European Union for money supply in the euro area; the European Central Bank (ECB) controls monetary policy for the 16 members of the Economic and Monetary Union (EMU); individual members of the EMU do not control the quantity of money and quasi money circulating within their own borders

Stock of narrow money


$951.3 billion (31 December 2011 est.)
$887.3 billion (31 December 2010 est.)
note: see entry for the European Union for money supply in the euro area; the European Central Bank (ECB) controls monetary policy for the 17 members of the Economic and Monetary Union (EMU); individual members of the EMU do not control the quantity of money circulating within their own borders

Stock of broad money


$2.62 trillion (30 October 2011 est.)
$2.336 trillion (31 December 2010 est.)

Stock of quasi money


$NA

Stock of domestic credit


$4.319 trillion (31 December 2009 est.)
$4.121 trillion (31 December 2008 est.)

Market value of publicly traded shares


$1.926 trillion (31 December 2010)
$1.972 trillion (31 December 2009)
$1.492 trillion (31 December 2008)

Agriculture - products


wheat, cereals, sugar beets, potatoes, wine grapes; beef, dairy products; fish

Industries


machinery, chemicals, automobiles, metallurgy, aircraft, electronics; textiles, food processing; tourism

Industrial production growth rate


2.4% (2011 est.)

Electricity - production


510 billion kWh (2009 est.)

Electricity - production by source


fossil fuel: 8.2%
hydro: 14%
nuclear: 77.1%
other: 0.7% (2001)

Electricity - consumption


460.9 billion kWh (2008 est.)

Electricity - exports


44.91 billion kWh (2009 est.)

Electricity - imports


25.7 billion kWh (2009 est.)

Oil - production


84,820 bbl/day (2010 est.)

Oil - consumption


1.861 million bbl/day (2010 est.)

Oil - exports


487,200 bbl/day (2009 est.)

Oil - imports


2.22 million bbl/day (2009 est.)

Oil - proved reserves


91.63 million bbl (1 January 2011 est.)

Natural gas - production


721 million cu m (2010 est.)

Natural gas - consumption


49.78 billion cu m (2010 est.)

Natural gas - exports


2.945 billion cu m (2010 est.)

Natural gas - imports


46.2 billion cu m (2010 est.)

Natural gas - proved reserves


6.796 billion cu m (1 January 2011 est.)

Current Account Balance


-$74.3 billion (2011 est.)
-$44.5 billion (2010 est.)

Exports


$578.4 billion (2011 est.)
$517.2 billion (2010 est.)

Exports - commodities


machinery and transportation equipment, aircraft, plastics, chemicals, pharmaceutical products, iron and steel, beverages

Exports - partners


Germany 16.4%, Italy 8.2%, Belgium 7.7%, Spain 7.6%, UK 6.8%, US 5.1%, Netherlands 4.2% (2009)

Imports


$684.6 billion (2011 est.)
$588.4 billion (2010 est.)

Imports - commodities


machinery and equipment, vehicles, crude oil, aircraft, plastics, chemicals

Imports - partners


Germany 19.3%, Belgium 11.4%, Italy 8%, Netherlands 7.5%, Spain 6.8%, China 5.1%, UK 5% (2009)

Reserves of foreign exchange and gold


$166.2 billion (31 December 2010 est.)

Debt - external


$5.633 trillion (30 June 2011)
$4.698 trillion (30 June 2010)

Stock of direct foreign investment - at home


$1.186 trillion (31 December 2011 est.)
$1.161 trillion (31 December 2010 est.)

Stock of direct foreign investment - abroad


$1.787 trillion (31 December 2011 est.)
$1.746 trillion (31 December 2010 est.)

United States Economy Profile 2012


The US has the largest and most technologically powerful economy in the world, with a per capita GDP of $48,100. In this market-oriented economy, private individuals and business firms make most of the decisions, and the federal and state governments buy needed goods and services predominantly in the private marketplace. US business firms enjoy greater flexibility than their counterparts in Western Europe and Japan in decisions to expand capital plant, to lay off surplus workers, and to develop new products. At the same time, they face higher barriers to enter their rivals' home markets than foreign firms face entering US markets. US firms are at or near the forefront in technological advances, especially in computers and in medical, aerospace, and military equipment; their advantage has narrowed since the end of World War II. The onrush of technology largely explains the gradual development of a "two-tier labor market" in which those at the bottom lack the education and the professional/technical skills of those at the top and, more and more, fail to get comparable pay raises, health insurance coverage, and other benefits. Since 1975, practically all the gains in household income have gone to the top 20% of households. Since 1996, dividends and capital gains have grown faster than wages or any other category of after-tax income. Imported oil accounts for nearly 55% of US consumption. Oil prices doubled between 2001 and 2006, the year home prices peaked; higher gasoline prices ate into consumers' budgets and many individuals fell behind in their mortgage payments. Oil prices increased another 50% between 2006 and 2008. In 2008, soaring oil prices threatened inflation and caused a deterioration in the US merchandise trade deficit, which peaked at $840 billion. In 2009, with the global recession deepening, oil prices dropped 40% and the US trade deficit shrank, as US domestic demand declined, but in 2011 the trade deficit ramped back up to $803 billion, as oil prices climbed once more. The global economic downturn, the sub-prime mortgage crisis, investment bank failures, falling home prices, and tight credit pushed the United States into a recession by mid-2008. GDP contracted until the third quarter of 2009, making this the deepest and longest downturn since the Great Depression. To help stabilize financial markets, in October 2008 the US Congress established a $700 billion Troubled Asset Relief Program (TARP). The government used some of these funds to purchase equity in US banks and industrial corporations, much of which had been returned to the government by early 2011. In January 2009 the US Congress passed and President Barack OBAMA signed a bill providing an additional $787 billion fiscal stimulus to be used over 10 years - two-thirds on additional spending and one-third on tax cuts - to create jobs and to help the economy recover. In 2010 and 2011, the federal budget deficit reached nearly 9% of GDP; total government revenues from taxes and other sources are lower, as a percentage of GDP, than that of most other developed countries. The wars in Iraq and Afghanistan required major shifts in national resources from civilian to military purposes and contributed to the growth of the US budget deficit and public debt - through 2011, the direct costs of the wars totaled nearly $900 billion, according to US government figures. In March 2010, President OBAMA signed into law the Patient Protection and Affordable Care Act, a health insurance reform bill that will extend coverage to an additional 32 million American citizens by 2016, through private health insurance for the general population and Medicaid for the impoverished. Total spending on health care - public plus private - rose from 9.0% of GDP in 1980 to 17.9% in 2010. In July 2010, the president signed the DODD-FRANK Wall Street Reform and Consumer Protection Act, a bill designed to promote financial stability by protecting consumers from financial abuses, ending taxpayer bailouts of financial firms, dealing with troubled banks that are "too big to fail," and improving accountability and transparency in the financial system - in particular, by requiring certain financial derivatives to be traded in markets that are subject to government regulation and oversight. Long-term problems include inadequate investment in deteriorating infrastructure, rapidly rising medical and pension costs of an aging population, sizable current account and budget deficits - including significant budget shortages for state governments - energy shortages, and stagnation of wages for lower-income families.

GDP (purchasing power parity)

$15.04 trillion (2011 est.)
$14.82 trillion (2010 est.)
$14.38 trillion (2009 est.)
note: data are in 2011 US dollars

GDP (official exchange rate)

$15.06 trillion (2011 est.)

GDP - real growth rate

1.5% (2011 est.)
3% (2010 est.)
-3.5% (2009 est.)

GDP - per capita (PPP)

$48,100 (2011 est.)
$47,800 (2010 est.)
$46,800 (2009 est.)
note: data are in 2011 US dollars

GDP - composition by sector

agriculture: 1.2%
industry: 19.2%
services: 79.6% (2011 est.)

Population below poverty line

15.1% (2010 est.)

Labor force

153.6 million
note: includes unemployed (2011 est.)

Labor force - by occupation

farming, forestry, and fishing: 0.7%
manufacturing, extraction, transportation, and crafts: 20.3%
managerial, professional, and technical: 37.3%
sales and office: 24.2%
other services: 17.6%
note: figures exclude the unemployed (2009)

Unemployment rate

9% (2011 est.)
9.6% (2010 est.)

Unemployment, youth ages 15-24

total: 17.6%
male: 20.1%
female: 14.9% (2009)

Household income or consumption by percentage share

lowest 10%: 2%
highest 10%: 30% (2007 est.)

Distribution of family income - Gini index

45 (2007)
40.8 (1997)

Investment (gross fixed)

12.4% of GDP (2011 est.)

Budget

revenues: $2.303 trillion
expenditures: $3.599 trillion
note: for the US, revenues exclude social contributions of approximately $1.0 trillion; expenditures exclude social benefits of approximately $2.3 trillion (2011 est.)

Taxes and other revenues

15% of GDP
note: excludes contributions for social security and other programs; if social contributions were added, taxes and other revenues would amount to approximately 22% of GDP (2011 est.)

Budget surplus (+) or deficit (-)

-8.9% of GDP (2011 est.)

Public debt

69.4% of GDP (2011 est.)
62.9% of GDP (2010 est.)
note: data cover only what the United States Treasury denotes as "Debt Held by the Public," which includes all debt instruments issued by the Treasury that are owned by non-US Government entities; the data include Treasury debt held by foreign entities; the data exclude debt issued by individual US states, as well as intra-governmental debt; intra-governmental debt consists of Treasury borrowings from surpluses in the trusts for Federal Social Security, Federal Employees, Hospital Insurance (Medicare and Medicaid), Disability and Unemployment, and several other smaller trusts; if data for intra-government debt were added, "Gross Debt" would increase by about one-third of GDP

Inflation rate (consumer prices)

3% (2011 est.)
1.6% (2010 est.)

Central bank discount rate

0.5% (31 December 2010)
0.5% (31 December 2009)

Commercial bank prime lending rate

3.2% (31 December 2011 est.)
3.25% (31 December 2010 est.)

Stock of money

$1.436 trillion (31 December 2008)
$1.383 trillion (31 December 2007)

Stock of narrow money

$1.943 trillion (31 December 2011 est.)
$1.866 trillion (31 December 2010 est.)

Stock of quasi money

$10.99 trillion (31 December 2008)
$10.12 trillion (31 December 2007)

Stock of broad money

$12.14 trillion (31 December 2010 est.)
$12.37 trillion (31 December 2009 est.)

Stock of domestic credit

$32.61 trillion (31 December 2009 est.)
$31.53 trillion (31 December 2008 est.)

Market value of publicly traded shares

$17.14 trillion (31 December 2010)
$15.08 trillion (31 December 2009)
$11.74 trillion (31 December 2008)

Agriculture - products

wheat, corn, other grains, fruits, vegetables, cotton; beef, pork, poultry, dairy products; fish; forest products

Industries

highly diversified, world leading, high-technology innovator, second largest industrial output in world; petroleum, steel, motor vehicles, aerospace, telecommunications, chemicals, electronics, food processing, consumer goods, lumber, mining

Industrial production growth rate

4.1% (2011 est.)

Electricity - production

3.953 trillion kWh (2009 est.)

Electricity - production by source

fossil fuel: 71.4%
hydro: 5.6%
nuclear: 20.7%
other: 2.3% (2001)

Electricity - consumption

3.741 trillion kWh (2009 est.)

Electricity - exports

18.11 billion kWh (2009 est.)

Electricity - imports

34.32 billion kWh (2009 est.)

Oil - production

9.688 million bbl/day (2010 est.)

Oil - consumption

19.15 million bbl/day (2010 est.)

Oil - exports

1.92 million bbl/day (2009 est.)

Oil - imports

10.27 million bbl/day (2009 est.)

Oil - proved reserves

20.68 billion bbl (1 January 2011 est.)

Natural gas - production

611 billion cu m (2010 est.)

Natural gas - consumption

683.3 billion cu m (2010 est.)

Natural gas - exports

32.2 billion cu m (2010 est.)

Natural gas - imports

105.8 billion cu m (2010 est.)

Natural gas - proved reserves

7.716 trillion cu m (1 January 2009 est.)

Current Account Balance

-$599.9 billion (2011 est.)
-$470.9 billion (2010 est.)

Exports

$1.511 trillion (2011 est.)
$1.289 trillion (2010 est.)

Exports - commodities

agricultural products (soybeans, fruit, corn) 9.2%, industrial supplies (organic chemicals) 26.8%, capital goods (transistors, aircraft, motor vehicle parts, computers, telecommunications equipment) 49.0%, consumer goods (automobiles, medicines) 15.0%

Exports - partners

Canada 19.4%, Mexico 12.8%, China 7.2%, Japan 4.7% (2009)

Imports

$2.314 trillion (2011 est.)
$1.935 trillion (2010 est.)

Imports - commodities

agricultural products 4.9%, industrial supplies 32.9% (crude oil 8.2%), capital goods 30.4% (computers, telecommunications equipment, motor vehicle parts, office machines, electric power machinery), consumer goods 31.8% (automobiles, clothing, medicines, furniture, toys)

Imports - partners

China 19.5%, Canada 14.2%, Mexico 11.8%, Japan 6.3%, Germany 4.3% (2009)

Reserves of foreign exchange and gold

$132.4 billion (31 December 2010 est.)
$130.8 billion (31 December 2009 est.)

Debt - external

$14.71 trillion (30 June 2011)
$13.98 trillion (30 June 2010)
note: approximately 4/5ths of US external debt is denominated in US dollars; foreign lenders have been willing to hold US dollar denominated debt instruments because they view the dollar as the world's reserve currency

Stock of direct foreign investment - at home

$2.874 trillion (31 December 2011 est.)
$2.674 trillion (31 December 2010 est.)

Stock of direct foreign investment - abroad

$4.051 trillion (31 December 2011 est.)
$3.817 trillion (31 December 2010 est.)